


doi: 10.15389/agrobiology.2012.5.78eng
УДК 633.1+633.34]:581.1:58.056:51-76
PREDICTION OF VEGETATION PERIOD DURATION IN SPRING CEREAL CROPS VARIETIES IN THE CONDITIONS OF CLIMATE CHANGES
L.Yu. Novikova1, V.N. Dyubin1, I.V. Seferova1, I.G. Loskutov1, 2, E.V. Zuev1
On the ground of long-term observations for the wheat, oat and soya specimens on four experimental stations contrasting with respect to climate conditions (N.I. Vavilov Institute of Plant Industry — VIR) the authors revealed the tendencies towards changes of agroclimatic factors, vegetation period duration in cultivated varieties and also determined the limiting factors for each examined station. The temperature necessities of varieties and their dependence on other climatic factors were determined. The abilities of two methods are considered — a regression analysis and effective temperature method. In the varieties districted early the authors predict the shortening of vegetation period as temperature will rise. The method of sequential differences increases the accuracy of regression analysis and determination of threshold temperatures for varieties. The method of effective temperatures permits to predict the duration of interphase periods in different geographic conditions.
Keywords: forecasting, climate changes, oat, wheat, soybean, regression in consecutive differences, effective temperatures.
Global climate change occurring since the 1970-ies along with regional bioclimatic shifts make it necessary to revise the commonly adopted zones of cultivation of crops. Earlier, studying plant varieties, N.I. Vavilov paid a special attention to their climatic requirements in connection to environmental conditions in centers of origin of species. Accordingly, he noted the major parameters of “ecological profile” of a variety – the duration of growing season and individual interphase periods (1).
Agroclimatic characteristics show local trends and region-specific performance (2-4). In the 40 years ahead the grain yield of cereals is expected to increase by 10-20% in the European North of Russia, and to decline by 6-26% - in the South (2). Therefore, any economic benefits will be obtained from an acreage only using an optimized set of varieties and species including the introduced ones capable for more efficient use of the increasing vegetation period – in the north, and drought-resistant – in the south.
Short- and medium-range prognoses of economically valuable characters developed by certain crops and varieties during a cultivation in a particular region are based upon the time-series analysis of these traits (4-6), which is an actually developing tool of modern economic studies (7, 8). Though this method has some limitations, such as the implied trend of agrotechnics strongly influencing the results of long-term observations (4-6), which distorts the nature of relationship between commercially valuable traits and agro-climatic parameters. For example, the technology of growing soya in the Krasnodarsky Krai since the 2000-ies provided high yields under adverse environmental conditions (9). In such cases, the climatic component of a trait can be isolated by regression analysis of deviations from the trend (4-6), and by analysis of differences (8).
Suppose that the value of an economically valuable trait y at the moment of time t (yt) is determined by the linear dependence from the climatic character Kt with the regression coefficient bK and yt , and it grows linearly with improvement of the applied cultivation technique with the rate b:
. |
Then, the analysis of correlations between increments of variables per year (the differences of values in adjacent years) allows determining the regression coefficient bK of baseline values of the economically valuable trait and its climatic character:
. |
The analysis of differences can give an additional information from synchronous observations of multiple objects (so-called “panel data”) (8). Increasing the sample size provides more reliable estimates of general regularities of processes. The approximation of non-climatic trend by polynomial approximate of the 2nd order allows the transition from the trend to differences of differences, that is, to the second-order differences (8, 10).
Air temperature is the main factor influencing plant growth rate and development (4). Agroclimatology estimates heat requirements of crops and varieties by the amount of active, effective, biological, and bioclimatic temperatures (4, 6, 11-13) with corrections for photo- and thermoperiodism (4). The total amount of average daily temperatures for a growing season and interphase periods have been established for crops with an accuracy up to maturity levels (4). In agrometeorological practice, the onset dates of phenophases can be predicted knowing the total amount of effective temperatures, which are the difference between the actual average daily temperature and the threshold value of a corresponding species and interphase period (6). This method has been successfully used in regions with excessive and sufficient moisture (4, 12). In practical guidelines, the threshold temperature of a growing season for wheat and oats are equal to 5 °C, for more southern crops (soy, maize) - 10 °C (4, 6). However, for varieties studied many years it is possible to determine more exactly the temperature thresholds and total amounts of effective temperatures (13, 14).
The purpose of this study was revealing of existing trends in the duration of growing season of grain crops in connection with the influence of agroclimatic factors, and estimating the probability of forecasting such changes by means of two methods - regression, including the sequence of differences, and total amounts of effective temperatures.
Technique. The studied varieties of oats (Borrus, Gumbo, Nemchinovsky 2, Gorizont, Krasnodarsky 73, Otter) and spring wheat (Leningradka, Moscovskaya 35, Kutulukskaya) were the standards used for assessment of the collection of N.I. Vavilov All-Russia Research and Development Institute of Plant Industry (VIR). Long-term monitoring of the duration of growing season was performed in four experimental stations located in different regions with contrasting climatic conditions: in Pushkin Laboratories (St. Petersburg-Pushkin), the former (before 2008) Moscow branch of VIR (Mikhnevo settlement, Moscow province), Ekaterinino Experimental Station (Ekaterinino settlement, Tambov province), and Kuban Experimental Station (Botanika settlement, Krasnodarsky Krai) – respectively, PL, MES, EES, and KES. Temperature requirements of soya in the period germination-flowering were determined in 9 early-maturing samples with weak photoperiodic response as compared in St. Petersburg (1999-2010) and Krasnodarsky Krai (2004, 2005). Along with it, in Pushkin Laboratories, 5 samples of soya from this set were evaluated in respect to the effects of sowing date on the duration of period germination-flowering, and the total amount of accumulated temperatures (2004-2006). Climatic factors were assessed using the data of local weather stations.
Linear trends in the dynamics of climatic characters and the duration of growing season of the varieties were determined by regression analysis. For each item of the study, the regression with sequential introduction of variables was calculated in StatSoft Statistica 6.0 to reveal correlations between the duration of growing season of the varieties and agroclimatic characters, and the climatic factors providing a significant impact on the duration of growing season. The regressional relationships between annual increments of economically valuable traits and those of agro-climatic characteristics were determined, i.e. the analysis of first differences (8, 15). The obvious resemblance of difference equations allowed to formulate integrated equations for varieties of oats and wheat in respect to each studied issue.
The threshold temperature exceeding which triggers the development of a variety (regression coefficient B), and the total amount of effective temperatures above the threshold (free term of the equation A) which must be accumulated by the variety to enter the next phase, were determined from linear equations describing the relationship between the total amount of average daily temperatures in the studied period (vegetative or interphase) (T) and its duration (L) (13, 14):
, i.e. |
|
. |
Parameterization of a variety was the task of determination of its least variable characteristics. The positive coefficient A in all studied varieties means that the coefficient of variation of the variable ∑T is less than the coefficient of variation of the variable L (8). The least-squares method used to construct regressional equations is based on isolation from the variance of a studied variable (in this case ∑T) of the variation caused by another variable (in this case L), so that the residual variance of the studied variable (equal to the variance of total amounts of effective temperatures) is minimal. Thus, the total amount of effective temperatures varies by years less than the total amount of temperatures in vegetation season. These relationships were also calculated in differences.
Along with it, the effects of precipitation during the period of study, sowing dates, daylight duration were evaluated in respect to the total amount of daily and effective temperatures.
The obtained regressional models were used to forecast the dynamics of growing season duration in oats and wheat under the persisting trend of climate change. The data on temperature requirements of soy obtained in Pushkin Laboratories were considered to project the expected duration of its maturation-germination period in Kuban Experimental Station, which prognoses were compared with actual recorded data.
The adopted significance level - 5%.
Results. In all regions of the research it was observed the elevation of summer temperatures, especially in July-August, as well as the total amounts of active and effective temperatures in periods of stable transition across 5, 10, 15 °C. In KES, the air temperatures began to increase since the 1990-ies, while before the 1960-ies there was a slight cooling. Total precipitation reduced in PL, increased – in EES, and remained unchanged in MES and KES (Table 1). In PL, the transition of air temperature over 5 and 10 °C in spring occurred earlier, which contributed to the increase in duration of periods with temperatures between 5 and 15 °C, 10 and 15 °C.
| 1. Assessment of the linear trend of agroclimatic characters and the duration of growing season in oats and wheat | ||||||||||
Point of research |
Tef.15 |
R15 |
L10-15 |
L5-15 |
Crop |
Variety (№ in VIR catalogue) |
years of study |
L |
Lc1 |
Lc2 |
PL |
4,4a |
-2,1a |
0,70a |
0,70a |
Oats |
Borrus (k-11840) |
1980-2011 |
-0,41 |
-0,44 |
-0,45 |
Wheat |
Leningradka (k-47882) |
1972-2006 |
-0,28 |
-0,37 |
||||||
MES |
7,9a |
0,1 |
-0,12 |
-0,26 |
Oats |
Gumbo (k-12362) |
1982-2006 |
0,18 |
0,11 |
-0,43 |
Oats |
Nemchinovsky 2 (k-13562) |
1983-2006 |
0,19 |
0,13 |
||||||
Wheat |
Moskovskaya 35 (k-48762) |
1976-2006 |
0,04 |
0,06 |
||||||
EES |
8,2a |
5,7a |
0,00 |
0,03 |
Oats |
Gorizont (k-12113) |
1981-2009 |
0,21 |
0,07 |
-0,20 |
Wheat |
Kutulukskaya (k-54213) |
1976-2009 |
-0,08 |
-0,04 |
||||||
KES |
8,9a |
0,8 |
0,06 |
0,43 |
Oats |
Krasnodarsky 73 (k-11526) |
1974-1988 |
0,22 |
-0,06 |
-0,01 |
Oats |
Otter (k-11868) |
1988-1998 |
0,31 |
0,16 |
||||||
Note. PL, MES, EES, KES – experimental stations of N.I. Vavilov Research Institute of Plant Industry (VIR): resp., in Pushkin Laboratories (St. Petersburg-Pushkin), Mikhnevo (Moscow province), Ekaterinin (Tambov province), and Kuban (Krasnodarsky Krai). Tef.15— the total amount of effective temperatures in the period of stable transition over 15 °С; R15 — the total amount of precipitation in the period of stable transition of temperature over 15 °С, mm;L10-15,L5-15— duration of the period between onset dates of stable transition of air temperature over 10 and 15 °С, 5 and 15 °С in spring, days; L — actual duration of vegetation, days;Lc1— calculated duration of vegetation according to the model in baseline values, Lc2— calculated rate of changes of the duration of vegetation according to the model in differences; а — reliable changes. |
||||||||||
|
Fig. 1. Duration of vegetation of varieties-standards oats Borrus (1), wheat Leningradka (2), oats Gumbo (3), oats Nemchinovsky 2 (4), wheat Moskovskaya 35 (5), oats Gorizont (6), wheat Kutulukskaya (7), oats Krasnodarsky 3 (8), and oats Otter (9) cultivated in four experimental stations of N.I. Vavilov Research Institute of Plant Industry (VIR) in different years: A — Pushkino Laboratories (St. Petersburg-Pushkin), B — former Moscow branch of VIR (Mikhnevo settlement, Moscow province), C — Ekaterinino Experimental Station (Ekaterinino settlement, Tambov province), D — Kuban Experimental Station (Botanika settlement, Krasnodarsky Krai). Denotations. АБВГ – ABCD abscissa – Years, ordinate – Duration of vegetation, days |
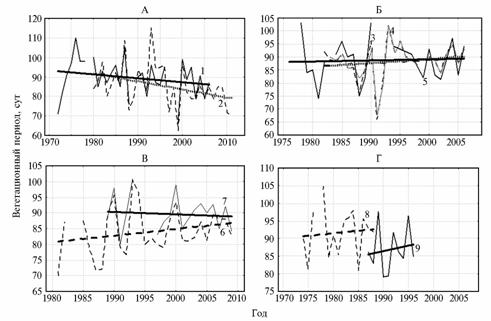
The most notable trend was the reduce in the duration of growing season of oat cv Borrus in Pushkin Laboratories (Fig. 1, Table 1) due to a shorter period of booting-ripening. In the variant of earlier sowing dates this variety demonstrated an earlier onset of germination, booting and maturation. The wheat cv Leningradka showed a weak tendency to reduce in duration of the phases earing-maturation and germination-maturation. In conditions of MES, the duration of growing season of the studied varieties-standards had a slight trend to prolongation. In EES, the oats cv Gorizont sown at the same dates exhibited later transition to booting and wax ripening, along with prolongation of interphase periods and the entire vegetation season. In wheat cv Kutulukskaya the duration of growing season remained almost unchanged. In KES, a slight increase in the duration of growing season was observed in oat cv Krasnodarsky 73 in 1974-1988 (which though were the cold years); cv Otter had a similar trend in 1987-1998 owing to early germination.
Regressional relationships were formulated to describe correlations between the duration of growing season and climatic characters in the studied standard varieties of oats and wheat (15, 16). Denotations of variables are shown in the footnote of Table 1; t - number of the year from 1975; R2 - coefficient of determination of the equation:
PL |
Borrus— L = 110,614 - 0,101∑Tef.15, R2 = 0,65; |
MES |
Gumbo — L = 85,905 - 0,036∑Tef.15 + 0,073L10-15 + 0,408t, R2 = 0,61; |
EES |
Gorizont — L = 84,512 - 0,034∑Tef.15 + 0,061R15, R2 = 0,66; |
KES |
Krasnodarsky 73 — L = 100,791 - 0,022∑Tef.155 + 0,153L5-15, R2 = 0,52; |
The most important climatic factor was the temperature growth, namely – the total amount of temperatures above 15 °C. The total amount of precipitation in this period and the duration of spring period with temperatures from 5 to 15 °C and 10 to 15 °C were significantly important as well. In MES the equation with a positive coefficient included the number of a year, i.e. there was a systematic positive non-climatic (presumably agrotechnical) impact on the duration of growing season. The actual average rate of changes of climatic characters was considered to calculate model rates of changes of the duration of vegetation period Lc1 (Table 1). It happened that in most of the series real trends were higher than the calculated ones, possibly due to positive agrotechnical trends in the 2000-ies.
Regression in first differences improved the quality of models for almost all series, which also indicates the presence of non-climatic trend (10, 15, 16). The difference equations formulated for the studied varieties and crops included similar specifications and coefficients in each item, free terms of the equations were insignificant. This allowed to develop generalized regression models (15):
PL |
DL = 0,397 - 0,102D∑Tef.15, R2 = 0,68; |
MES |
DL = 0,836 - 0,052D∑Тef.15 + 0,145DL10-15, R2 = 0,53; |
EES |
DL = 0,899 - 0,034D∑Тef.15 + 0,014DR15, R2 = 0,58; |
KES |
DL = -0,851 + 0,242DL5-15 - 0,013D∑Tef.15, R2 = 0,52. |
These models not including the free term were used to calculate the forecast of climate-related dynamics in the duration of growing season Lc2 (Table 2). According to this forecast, it is expected the reduce of growing season under the critical influence of temperature growth exceeding the effects of other factors, which may be partially compensated by increase in the amount of precipitation or earlier sowing date.
For oat cv Borrus, Gorizont, Krasnodarsky 73, Otter and wheat cv Leningradka it was determined the total amount of average daily temperatures during a vegetation (∑T), the threshold temperatures and the total amount of effective temperatures (∑Tef.) (Table 2). The total amount of effective temperatures and the threshold temperatures were obtained through the regression equation describing the relationship between ∑T and the duration of growing season. As expected, the standard deviation of ∑Tef. values was less than the standard deviation of ∑T.
2. Duration and temperature characteristics of a growing season in oats and wheat varieties cultivated in different agroclimatic conditions |
|||||
Variety (crop) |
Point of research |
Duration, days |
Amount of average daily temperatures, °С |
Threshold temperature, °С |
Amount of effective temperatures above the threshold, °С |
Borrus (oats) |
PL |
85,4±10,9 |
1408,2±100,5 |
7,2±1,2 |
805,0±66,6 |
Leningradka (wheat) |
PL |
89,5±9,6 |
1485,0±88,5 |
8,7±1,5 |
726,3±37,6 |
Gorizont (oats) |
EES |
84,0±7,5 |
1537,0±120,9 |
5,4±3,3 |
1072,0±120,6 |
Krasnodarsky 73 (oats) |
KES |
91,7±6,8 |
1551,0±79,4 |
7,3±2,6 |
884,9±62,0 |
Otter (oats) |
KES |
86,9±6,4 |
1400,0±87,6 |
9,5±3,4 |
573,6±62,7 |
Note. PL, MES, EES, KES – experimental stations of N.I. Vavilov Research Institute of Plant Industry (VIR): resp., in Pushkin Laboratories (St. Petersburg-Pushkin), Mikhnevo (Moscow province), Ekaterinin (Tambov province), and Kuban (Krasnodarsky Krai). The data show mean values and standard deviations, for threshold temperature – standard error of determination. |
|||||
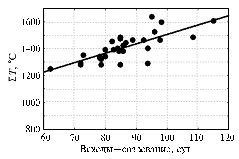
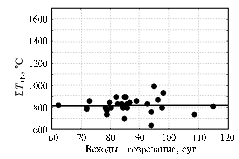
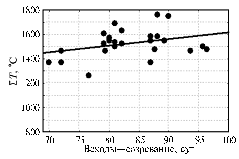
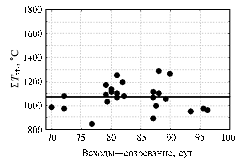
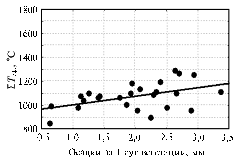
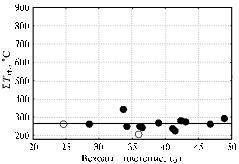
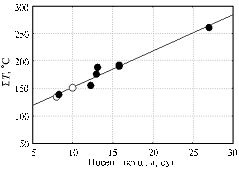
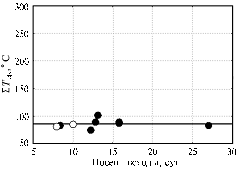
A strong correlation between the total amount of average daily temperatures and the duration of vegetation was observed only in PL (r = 0,74 – cv Borrus, r = 0,88 – cv Leningradka); the weakest one – in oats cv Gorizont (r = 0,33). In oats, ∑T and ∑Tef. were found to be correlated with other factors: in cv Borrus - with sowing date (for ∑Tef.r = 0,65), in cv Gorizont – with the average total amount of daily precipitation (for ∑Tef.r = 0,50). The 1 mm increase in the average daily precipitation during vegetation corresponded to the increase in total amount of effective temperatures by 76 °C (Fig. 2). These results were consistent with facts reported in the scientific literature (17, 18).
The threshold temperatures of different varieties had no reliable differences, which allowed formulation of a joint equation in first differences. According to it, the threshold temperature of the studied sampled population is 6 °C, which is close to that mentioned in agro-meteorological forecasts – 5 °C (4, 12). Knowing the rate of growth of the total amount of effective temperatures above 5 °C in PL (9,2 °C / year) and in KES (12,1 °C / year), and the temperature requirements of different varieties, it is possible to predict which ones will develop the most efficient utilization of the thermal resource. However, in EES using this method is difficult, because plant growth and development depend on the amount of precipitation.
The studied samples of soya in conditions of KES showed the duration of phases sowing-germination and germination-flowering shorter by an average of 5 and 8 days, while the total amount of temperatures in these periods was less, respectively, by 36 and 117 °C (differences reliable) than in PL, and the total amount of effective temperatures – by 2 and 12 °C (differences not reliable).
In PL, the duration of growing season wasn’t subject to any significant trends. Regression analysis showed that the major climatic factor determining the duration of period germination-flowering was the total amount of temperatures above 15 °С (r = -0,73, in first differences r = -0,89), therefore, this factor can be used in forecasting, and the temperature growth very probably leads to the reduce in duration of growing season.
А |
Б |
|
|
В |
Г |
|
|
Д |
Е |
|
|
Fig. 2. Temperature characteristics of a growing season in oats cv Borrus (А, В, C; 1980-2011, Pushkin Laboratories of VIR, St. Petersburg-Pushkin) and Gorizont (D, E, F; 1981-2009, Ekaterinino Experimental Station of VIR, Ekaterinino settlement, Tambov province): A, D— total amount of average daily temperatures in the period germination-maturation, B, E— total amount of effective temperatures in the period germination-maturation, C — relationship between the amount of effective temperatures and sowing date, F — relationship between the amount of effective temperatures and the amount of precipitation per day of vegetation. |
|
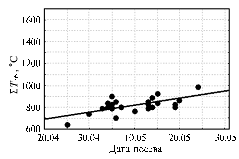
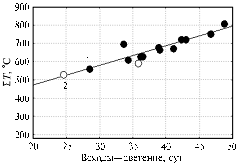
During the study of soya in conditions of Pushkin Laboratories (Table 3), it was found that variation in the total amounts of effective temperatures in the period germination-flowering was less than variation in the total amounts of average daily temperatures. No significant relations between the total amounts of temperatures in this period (and the total amounts of effective temperatures) and moisture conditions or germination date were found. The similar results were found in reports of other researchers (19). For these samples, the threshold temperature in the period germination-flowering in PL averaged 10,5 °C (Fig. 3, A), which is consistent with the literature data (4), while the total amount of effective temperatures above 10,5 °C – 264,5 °C (Fig. 3, B) (Tgermination—flowering = 264,5 + 10,5Lgermination—flowering, R2 = 0,80).
| 3. Duration and temperature characteristics of the period germination-flowering in soya samples of different origin in the conditions of Pushkino Laboratories of N.I. Vavilov Research Institute of Plant Industry (VIR) (St. Petersburg-Pushkin, 1999-2010). | |||||
Sample, variety (№ in VIR catalogue) |
Origin |
Duration, days |
Amount of average daily temperatures, °С |
Threshold temperature, °С |
Amount of effective temperatures above the threshold, °С |
1040-4-2 (k-5830) |
Sweden |
40±6 |
687,1±69,3 |
9,9±1,4 |
296,9±33,8 |
Okskaya (k-9959) |
Russia |
43±8 |
741,3±99,9 |
11,3±1,8 |
260,3±52,4 |
Svetlaya (k-9960) |
Russia |
38±5 |
661,5±47,1 |
6,6±2,4 |
406,8±37,1 |
Altom (k-10043) |
Russia |
43±6 |
746,4±87,1 |
12,9±2,7 |
190,0±45,2 |
KG-20 (k-10539) |
Canada |
41±11 |
725,3±156,4 |
13,8±1,5 |
155,2±48,9 |
PEP 2 (k-10651) |
Russia |
37±4 |
632,8±47,0 |
8,6±2,6 |
314,7±33,9 |
PEP 18 (k-10655) |
Russia |
36±4 |
622,9±59,1 |
11,1±2,6 |
221,3±41,6 |
PEP 27 (k-10659) |
Russia |
39±5 |
654,7±64,1 |
11,0±1,4 |
230,3±32,2 |
PEP 28 (k-10660) |
Russia |
35±4 |
599,6±57,4 |
11,4±2,3 |
199,1±40,0 |
Mean |
|
39±6 |
674,6±76,4 |
10,5±1,7 |
264,5±31,0 |
Note. The data show mean values (X) and standard deviations (Sx) (for threshold temperature — standard error of determination Sx). |
|||||
А |
Б |
|
|
В |
Г |
|
|
Fig. 3. The amount of mean daily (A, C) and effective (B, D) temperature for the period sprouts-flowering (A, B) and sowing-sprouts (C, D) in studied samples of soy: 1 — Pushkin Laboratories (St. Petersburg-Pushkin, A and B— 1999-2010, C and D — 2004-2006), 2 — Kuban Experimental Station (Botanika settlement, Krasnodarsky Krai, 2004, 2005). |
|
The onset dates of flowering of soya in KES were calculated in 2004 and 2005 upon the data obtained in PL (mean total amounts of average daily and effective temperatures in the period germination-flowering); in respect to actual dates, the error for the effective temperatures ranged 1,5-6,0 days over the samples, for the total amounts of average daily temperatures in this period - from 2,5 to 9,0 days, so, the calculations based on the total amounts of effective temperatures provided more accurate forecast.
In five samples of soya (1040-4-2, Okskaya, Svetlaya, PEP 27, PEP 28), the developmental period from sowing to germination was investigated during the studies in PL in 2004-2006 while sown in various dates and in KES in 2004-2005 (Fig. 3, C, D). The samples sown 2 weeks earlier than the optimum for local conditions, passed this period on average 5 days longer than ones sown in optimum time. The samples sown 2 weeks later than the optimum in 2005 passed this period 5 days faster. In KES and in PL differences in duration of the period sowing-germination while unequal sowing dates and climatic conditions were almost completely (96%) determined by the time necessary to accumulate the total amount of effective temperatures above 6,6 °C equal to 86,2 °C (Tsowing—germination = 86,2 + 6,6Lsowing—germination, R2 = 0,96).
Therefore, the total amounts of effective temperatures for the periods sowing-germination and germination-flowering of the studied samples of soya in conditions of St. Petersburg and Krasnodarsky Krai were close to constant.
So, the temperature growth in summertime was recorded over the years of research in all points of study. The total amount of precipitation decreased in Pushkin Laboratories (PL), increased – in Ekaterinino Experimental Station (EES), remained unchanged in Moscow region (MES) and in Kuban Experimental Station (KES) of N.I. Vavilov Research Institute of Plant Industry (VIR). In Pushkin, the period with temperature from 10 to 15 °C has become longer. The duration of growing season of the studied cereals has reduced in Pushkin and increased – in EES. It was predicted that growing season of earlier zoned spring cereals should reduce owing to the growth of effective temperatures above 15 °C. In some regions it may be compensated by longer duration of the periods with air temperatures from 5 to 15 °C and 10 to 15 °C, along with increase in amount of precipitation. A compensative effect of agrotechnical trends has been observed since the 2000-ies. Calculations based on successive differences improve the accuracy of regression analysis used to assess the climate–dependant duration of growing season and determine the threshold temperatures of varieties. The method of effective temperatures can be suggested for forecasting of the duration of interphase periods in crop varieties grown in different geographical conditions, though its use is limited in cases when vegetation is restricted by precipitation deficit.
REFERENCES
1. Vavilov N.I., Mirovye resursy sortov khlebnykh zlakov, zernovykh bobovykh, l’na i ikh ispol’zovanie v selektsii. Opyt agroekologicheskogo obozreniya vazhneyshykh polevykh kul’tur (World Resources of Cultivated Varieties of Cereals, Leguminous Seed Crops, Flax and Their Utilization in Plant Breeding. The Experience of Agronomic and Ecological Review of Major Field Crops), Moscow-Leningrad,1957.
2. Gordeev A.V., Kleschenko A.D., Chernyakov B.A., Sirotenko O.D., Temnikov V.N., Uskov I.B., Romanenkov V.A., and Roukhovich D.I., Bioklimaticheskiy potentsial Rossii: Mery Adaptatsii v Usloviyakh Izmenyayuschegosya Klimata (Bioclimatic Potential of Russia: Adaptation under Changed Climate), Moscow, 2008.
3. Sirotenko O.D., Kleschenko A.D., Pavlova V.N., Abashina E.V., and Semendyaev A.K., Climate Change Monitoring and Assessment of Climate Change Impact on Agriculture, Agrofizika, 2011, vol. 3, pp. 31-39.
4. Mischenko Z.A., Agroklimatologiya (Agroclimatology), Kyiv, 2009.
5. Nikolaev M.V., Sovremennyi klimat i izmenchivost’ urozhaev (Present Climate and Crop Yield Variability), St. Petersburg, 1994.
6. Rukovodstvo po agrometeorologicheskim prognozam. T. 1. Zernovye kul’tury (Guidelines on Agrometeorological Forecasting. Vol. 1. Grain Crops), Ulanov E.S., Moiseychik V.A., and Polevaya A.N., Eds., Leningrad, 1984.
7. Box G. and Jenkins G., Analiz vremennykh ryadov. Prognoz i upravlenie (Time Series Analysis. Forecasting and Control), issue 1-2, Moscow, 1974.
8. Eliseeva I.I., Kurysheva S.V., Kosteeva T.V., Pantina I.V., Mikhailov B.A., Neradovskaya Yu.V., Shtroe G.T., Bartls K., and Rybkina L.R. ,Ekonometrika (Econometrics), Eliseeva I.I., Ed., Moscow, 2007.
9. Baranov V.F., Stabilization of the Productivity of Soybean Agrocenoses in Connection with Global Climate Changes, in Sb. statey 2-oy Mezhd. konf. po soye “Sovremennye problemy selektsii i tekhnologii vozdelyvaniya soi” (Proc. 2nd Int. Sci. Congress “Soybeans: Modern Issues of Breeding and Cultivation Techniques”), Krasnodar, 2008, pp. 253-256.
10. Seferova I.V., Novikova L.Yu., and Nekrasov A.Yu., Evaluation of the Response of Soy Variety Komsomolka to Climate Changes in Krasnodarsky Krai, Maslichnye kul’tury, 2011, issue 1 (146-147), pp. 72-77.
11. Podolsky A.S., Fenologicheskiy prognoz (Phenological Prognosis), Moscow, 1974.
12. Shashko D.I., Printsipy agroklimaticheskogo rayonirovaniya. Voprosy agroklimaticheskogo rayonirovaniya SSSR (Principles and Issues of Agroclimatic Zoning), Moscow, 1958, 38-92.
13. Shigolev A.A., Rukovodstvo dlya sostavleniya fenologicheskikh prognozov (ozimaya rozh’, ozimaya pshenitsa, yarovaya pshenitsa, plodovye kul’tury, drevesnye rasteniya lesnykh nasazhdeniy). Sel’skokhozyaystvennaya meteorologiya: Metod. Ukaz., (Manual on Phenological Forecasting for Winter Rye, Winter and Spring Wheats, Fruit Crops, and Forest Trees. The Guidelines on Agricultural Meteorology), Moscow – Leningrad, 1951, issue 15.
14. Babushkin L.N., About Some Methods of Determination of Temperature Effects on the Rate of Development of Agricultural Crops (Tashkent Experimental Station, Bozsu), Trudy po sel’skokhozyaystvennoy meteorologii, 1938, vol. 25, pp. 97-110.
15. Novikova L.Yu., Djubin V.N., Loskutov I.G., Zuev E.V., and Seferova I.V., The Forecast of Dynamics of Economic Valuable Characters of Grain Crops in the Conditions of Climate Change, Agrofizika, 2011, vol. 4, pp. 1-9.
16. Novikova L.Yu., Djubin V.N., Loskutov I.G., Zuev E.V., and Seferova I.V., The Forecast of Dynamics of Economic Valuable Characters of Varieties of Grain Crops in the Conditions of Climate Change, in Mat. Vseross. nauch. konf. “Metody otsenki sel’skokhozyaystvennykh riskov i tekhnologii smyagcheniya posledstviy izmeneniya klimata v zemledelii” (Proc. All-Russia Sci. Congress “Agriculture Sustainability and Evaluation of Risks under Climate Change”), St. Petersburg, 2011, 176-179.
17. Loskutov I.G., Oves (Avena L.). Rasprostranenie, sistematika, evolutsiya i selektsionnaya tsennost’ (Oats (Avena L.). Distribution, Taxonomy, Evolution and Breeding Value), St. Petersburg, 2007.
18. Rodionova N.A., Soldatov V.N., Merezhko V.E., Yarosh N.P., and Kobylyansky V.D., Kul’turnaya flora. T. II, ch. 3. Ovyos (Cultivated Flora. Vol. II, Part 3. Oats), Kobylyansky V.D. and Soldatov V.N., Eds., Moscow, 1994.
19. Stepanova V.M., Bioklimatologiya soi (Bioclimatology of Soya), Leningrad, 1972.
1 N.I. Vavilov Research Institute of Plant Industry, RAAS, St. Petersburg 190000, Russia, |
Received May 10, 2012 |
![]()