


doi: 10.15389/agrobiology.2012.5.111eng
УДК 579.8.06
THE EVOLUTIONARY SPACE OF BACTERIAL 16S rRNA GENE v. 1.0.
A.S. Dolnik1, G.S. Tamazyan1, E.V. Pershina2, K.V. Vyatkina3, Yu.B. Porozov4, A.G. Pinaev2, E.E. Andronov2
A systematicity in taxonomy, basically related to evolution, remains one of the greatest problem of in modern biology, and in particular microbiological topology. This problem has always attracted the attention of scientists, including N.I. Vavilov. He proposed a law of homologous series which, of course, must be regarded as the most striking in the current attempts to make analysis of biodiversity. In the molecular ecology of microorganisms, the demand for universal taxonomic system is particularly evident. Introduction of the new generation sequencing techniques into molecular ecology studies requires introduction of the radically new statistical approaches. This problem can be solved by the creation of the «metataxonomy», an integral approach for the analysis of the microbial communities, allowing to study microbial communities as a whole. It is related to a number of questions in evolutionary biology, taxonomy, mathematics, geometry and demands large computing. One of the most important problems is thr detection in 16S rRNA libraries of large amount of taxonomically «not attributed» sequences. To resolve this problem we propose the «evolutionary space» of 16S rRN gene, where fixed coordinates exist for every possible variant of 16S rRNA gene regardless of whether this variant is present in biosphere/database or even implemented in the course of evolution. In the current article we present the results of the analysis of a 16S rRNA gene database, where for the first time we constructed «evolutionary space», the assumed operational environment for «metataxonomy». The evolutionary space makes it possible to use a number of powerful statistical approaches aimed to analyse complex microbial community as a whole. Here we present the first version of evolutionary space with minimal possible dimension (13D).
Keywords: evolutionary space, metataxonomy, 16S rRNA, microbial community.
Taxonomic structure of the biota and basic laws determining species’ ecology, geographical distribution and evolution are among the fundamental problems of biology since early times of famous naturalists and founders of genetics. The accumulation of scientific knowledge promoted such studies that has reached in recent decades the level of molecular genomics of investigated objects.
“Everything is everywhere, but the environment selects” is a well-known statement of M.W. Bejerinck, one of the founders of microbial ecology, formulated about100 years ago and still remaining very fruitful scientific idea with a powerful heuristic potential (1). Applied to agricultural microbiology, it points the possibility of solving the inverse problem – determining agroecological condition of soil upon the analysis of soil microbiota. The presented work is directly linked to this issue. A modern taxonomy of soil microbiota was based on the isolation of soil DNA (RNA), pooling these data in databases of taxonomically significant genes (e.g., 16S-rRNA), sequencing them, and further taxonomic identification (2). The result of such studies is a list of identified taxa. Today, the new generation of sequencers introduced in applied studies on molecular ecology allows increasing the number of identified nucleotide sequences up to tens of thousands in each individual sample (3, 4). Working through such extensive lists is quite difficult even while a plenty of available target software (5-7) developed for sequence analysis and related purposes. There’s a number of important and still unsettled problems associated with analysis of such data – the difficulty of accounting taxonomically unattributed sequences belonging, as a rule, to unidentified taxa that often represent a significant share of microbial communities; the difficulty of simultaneous analysis of nucleotide sequences – different regions of one gene; the absence of integrated statistical approaches for description of complex communities as a single unit.
The hypothesis of an evolutionary space can be a possible way to solve the abovementioned problems. A particular task of this study was determining the evolutionary space of a global diversity of nucleotides and evolutionary processes of a single gene, specifically 16S-rRNA gene. The evolutionary space of 16S-rRNA gene can be described as a metric space including multiple points that represent nucleotide sequences of this gene in various microbes, and distances between each pair of points reflecting evolutionary distances between the corresponding nucleotide sequences. Such problems are conventionally related to multidimensional scaling and practically implemented in the matrix of pairwise genetic distances constructed within a metric space where geometric distances between the points correspond to their evolutionary distances. This allows calculating geometric coordinates of the point for any nucleotide sequence of 16S-rRNA gene reflecting its location within the space. Such a simple definition though involves a wide range of problems on molecular evolution, taxonomy, mathematics, geometry; besides, the computational complexity of this task is very high. But if complete successful, the evolutionary space can be a fundamentally new environment for molecular taxonomic analysis of complex microbial communities showing a number of new integral characteristics, such as density, size, geometry, center point (of a total community or individual taxa ), etc. In addition, representatives of any, even unknown taxa, can be defined in a fixed position, which greatly simplifies the analysis on unattributed elements of microbial communities and allows a universal “taxonomic map” locating every sequence in its fixed position.
Interestingly, that the mentioned issue is apparently closely associated with another problem of fundamental taxonomy – a so-called natural classification of organisms in which each object is attributed to the position corresponding to its relationship with other organisms. First announced by K. Linnaeus in his “The Philosophy of Botany” in 1751, it hasn’t been solved so far (8). Ch. Darwin paid much attention to this issue as well (9). In Russia, the major role in it belongs to N.I. Vavilov (10) – his works significantly complemented the concept of biological species; Vavilov’s law of homologous series is the fixed fact of parallelism in genetic variability of organisms and, undoubtedly, one of first attempts to create a unified system describing actual biodiversity and pointing the missing taxa.
Discussion on the history of this issue goes far beyond this study that wasn’t focused at construction of such system. The authors’ task was to describe the diversity of nucleotide sequences of a single bacterial gene 16S-rRNA based on the idea of evolutionary space.
Technique. The analysis was performed using the data of release SSURef_104_SILVA_NR_99 available on SILVA server (http://www.arb-silva.de/no_cache/download/ar-chive/release_102/Exports/). The release included aligned nucleotide sequences of 16S-rRNA gene of high quality, the length of at least 1000 n; all sequences with similarity more than 99% were removed from this release, which, obviously, didn’t affect geometric relations. After exclusion of Archaea, in the database remained 210,651 nucleotide sequences corresponding to bacterial 16S-rRNA genes. Instruments and software used in analysis: <RDBMS MSSQL Server 2008 R>, MatLab R2009b, Revolution R 4.3, a customized program for c, c #, c + +.
Constructing the matrix of distances and searching simplexes. The pairwise distances between the sequences were calculated using p-distance (pairwise deletion), which is a proportion of different nucleotide positions calculated through pairwise deletion of the positions containing gaps and degenerate nucleotides. Based on these calculations it was formed the matrix of pairwise distances for the total database with entries – identifiers of sequences. In addition, it was also determined distribution of phyla in the database and distribution of pairwise distances within the matrix.
Searching for simplexes was performed in a specified range of distances [0,251-0,269] providing impossibility of erroneous inclusion of radius into the simplex: in an unbounded simplex the ratio of an edge to radius equal to Ö2 (the proof is not given), and in the case of a 14-dimensional space, it is ~ 1,463 (0,269/1,463 ~ 0,183 << 0,251). As scanning of all available variants wouldn’t take any reasonable time even in the abridged database, so simplex search was carried out using a so-called “greedy strategy” based on identification of candidate sequences linked to the maximum number of pairwise distances that lie within a given range, and then stepwise adding them to the lists. In order to expand the area of search, a stochastic function was introduced in the algorithm (random selection from the list of candidates), which was found to operate very effective. The result of calculations was a series of identified simplexes of various sizes; the maximum ones were selected for further analysis.
Mapping sequences. Mapping sequences in the evolutionary space was conducted using simplex 6 (see “Results”). Positioning of points was performed as follows: points of the simplex ({s1, s2, ..., s14}) were placed on the coordinate axes in the order of the position number (point number corresponds to the number of axis); there were adopted equal distances between the sequences - the simplex vertices (although they actually weren’t equal) normalized to a unit. Thus, all distances in the system were also scaled proportionally to the simplex scaling, i.e. they were divided by the arithmetic mean of distances between the simplex vertices, which is 0,261.
The coordinates of points for each of 16S-rRNA gene variants in space were determined as follows. Initially, there were the distances from X sequence to the reference sequences – the simplex vertices {r1, r2, ..., r14}, normalized to the abovementioned factor. The task was finding 14 such points {x1, x2, .., x14} in this space that would satisfy two conditions: first - the points are located in a corresponding distance from the vertices, that is, dist(x1, s1) = r1, dist(x2, s2) = r2, …, dist(x14, s14) = r14; second - a total distance (penalty function) between these points is minimal: dist(x1, x2) + dist(x1, x3) + … + dist(x13, x14) → min.
This problem relates to the quadratic (nonlinear) optimization with constrained conditions. It can be solved using a rapidly converging gradient descent method with Laplace parameters, but in this case, since the constrained conditions were quadratic, the optimization was performed using the interior point algorithm as implemented through fmincon function from Optimization Toolbox MatLab.
Had found the set of points {x1, x2, .., x14} as described above, X-coordinate was taken as the center of mass (coordinatewise average) of the identified points. If the center of mass doesn’t coincide with the given simplex, there is applied orthogonal projection. It should be noted that results of the experiment suggested the value of penalty function close to zero, which indicated the proximity of the points {x1, x2, .., x14} to each other. Geometric distances of dist function were calculated using Euclidean metric.
The accuracy of mapping was estimated by calculated correlations between the matrixes of pairwise distances – true and calculated in geometric coordinates, by means of Mantel-Haenszel method (11).
Visualization of distributions. Distribution of the points in a 14-dimensional space (in fact, a 13-dimensional; the extra dimension was introduced only for computational convenience) was visualized using two-dimensional plane sections of a small thickness selected within the range that couldn’t be distinguished due to approximation errors in calculations and discontinuity of p-distance. It was totally performed about 1000 sections by a series of parallel planes that were located in one of the directions and designated by two axes (eg, 2-12 - the plane with axes 2 and 12).
Results. Visualization of the nucleotide sequences of 16S-rRNA gene as points in space isn’t a new idea. However, most of researchers in this field operate with statistical approaches aimed at construction of various projections, eg. principal components method allowing spatial representation of the matrix of pairwise distances (12, 13). For the given task, the most close attempt was constructing a multidimensional vector space of evolutionary processes in vertebrates upon the data of amino acid sequence of α-hemoglobin (14). The authors proposed the practical approach based on the idea of multidimensional evolutionary space and the fundamental impossibility of such constructions in a low-dimensional space. Target elements of such constructions are simplexes – geometric figures with equal distances between any two vertices; the simplest simplexes are equilateral triangle (2D) and a regular tetrahedron (3D). Simplexes with 5 or more vertices can be constructed only in a multidimensional space. In this work, simplex search was performed in a matrix of pairwise evolutionary distances of 16S-rRNA gene upon the data of an international database release. The identified simplexes revealed the minimal dimensionality of a target space and were used in further mapping as defining points.
Database structure and distribution of pairwise distances. Figure 1 shows the distribution of phyla by number of representatives in the working database (shown only the phyla represented by more than 0,9% entries of total) and pairwise distances in the corresponding matrix.
A |
B |
|
|
Fig. 1. Distribution of nucleotide sequences of 16S-rRNA gene in the working database of bacterial phyla (A) and distribution of pairwise distances in the matrix (B). |
|
It should be noted a quite nonuniform distribution of phyla in the database, which slightly complicated the analysis. The majority of entries were representatives of Proteobacteria, Firmicutes, Actinobacteria, Bacteroidetes, Acidobac-teria, Cyanobacteria, Chloroflexi, Planctomycetes, Spirochaetes, Verrucomicrobia, Gemmatimonadetes, Nitrospirae, Lentisphaerae, Synergistetes, Chlorobi. Chlorobi was the least represented phylum of 505 entries. Such distribution can be explained, firstly, by nonuniform distribution of phyla in the biosphere, and secondly, by peculiarities of scientific researches providing entries for databases. Though a uniform distribution is the best desired for all current studies using such computations, but the given database is one of the most complete by now, so the deviation has to live.
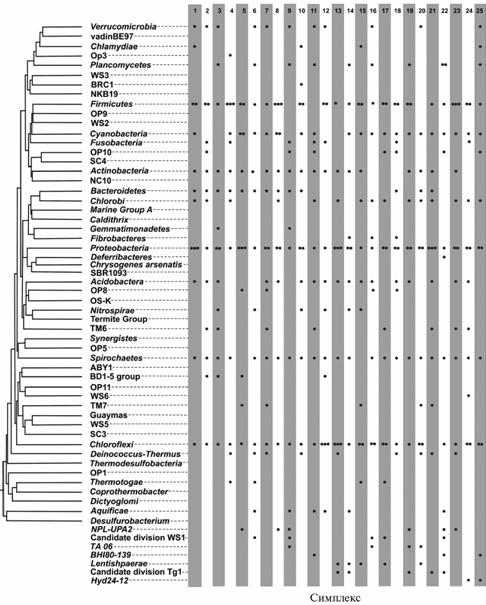
Identification of simplexes. It was revealed 25 nearly regular simplexes in the studied database: each one included 14 vertices corresponding to a 13-dimensional space, the distances between vertices ranged [0,251-0,269]. Since it was low probable to find perfectly regular simplexes in this database, so the calculations were performed considering the range whose width was specified to avoid location of a radius within the simplex (see “Technique”). The list below shows the identified simplexes (numbers from 1 to 25) and graphical representation of their distribution among major bacterial phyla (Fig. 2):
1 |
EU773611; EU491566; AJ542543; AY485285; AB355037; X86688; EU703430; Y10649; EF096697; EF516823; EU804917; AY571792; AM420109; AJ306801 |
2 |
EU469976; EU503653; GQ502583; AF189244; AY212563; AY907749; GQ397076; FJ628180; DQ814080; EU669608; DQ811945; AB191897; GQ346956; EU245865 |
3 |
FJ231137; EU135237; DQ795973; EU776122; AY863081; EU881151; EF020301; EU802835; AB488334; AB300126; EU038002; EU246179; FJ545465; CU924649 |
4 |
AF419696; EU506479; EU507872; DQ811928; D11348; FJ456773; X71862; FN563192; CP001110; FJ648694; AF068427; EU335420; AY743263; FN556062 |
5 |
EU381735; EF688230; EU370505; EF454921; EU799550; EF575061; FJ821610; FN401325; GU061319; FJ873298; AY280413; EU135375; FJ592895; GQ350871 |
6 |
FJ438004; GQ246374; FJ881166; EU005687; X73976; EU463251; DQ337095; AY225654; AY605151; FJ478836; FJ628268; FJ901103; CP001080; CU925754 |
7 |
DQ803694; EU767531; X12742; X81063; EU869405; EU134585; EU360497; AY571796; AY197394; AB177131; EF203193; FJ976270; EU134048; FJ891053 |
8 |
EU465688; EU511290; FJ366892; AB188635; AY663886; GU127275; EU775151; FJ717259; EU804722; FJ456653; EU491403; AJ431238; CU922689; FJ516821 |
9 |
EF575007; FJ748813; EU366375; AM712329; DQ248296; FJ983028; GQ263308; FJ802296; AY605160; EF076074; DQ906017; AB294345; CU923425; DQ330595 |
10 |
EU074225; CT573820; CU925797; DQ800076; EU037954; FJ976253; AB464934; DQ308543; FJ192842; EF019248; EU250258; AB243263; EU133963; X84212 |
11 |
AB277853; EU478629; EF522262; EU772741; EU635952; AY907749; CP001099; EU134803; EU159562; AB245338; GQ397047; AB192244; CU923893; DQ499300 |
12 |
EU507587; U32593; M24483; AM712329; FJ826329; AJ867904; EF019021; AF543503; DQ676428; EU266879; CU922282; EU043840; GQ340131; DQ906038 |
13 |
EU505590; FJ858737; FJ628297; AB240485; EU134568; U91515; EU132320; AB031999; CU921210; EU134128; GQ264185; EU289449; CU920242; FJ625343 |
14 |
FJ748815; EU503864; FJ159133; EU010170; EF453815; EU135522; EF018434; EF515949; X86774; AB198654; CU918198; AB462555; CR933027; FJ264554 |
15 |
AY114316; EU463474; GQ275102; FJ382145; AY672075; DQ906842; DQ005880; GQ264171; M79383; EU134919; AM934777; EU134038; CU921544; EU850520 |
16 |
EF520637; FJ873260; DQ809643; EU617874; AB286524; EU470375; FN430655; FJ478875; DQ811949; EF203193; EU245088; FJ478622; CU925754; EF192905 |
17 |
AB192054; EU509270; GQ441271; AY188316; DQ906842; AB286350; GU118530; AY945884; AB088905; CU922949; FJ517055; CU918272; CU927871; AY114333 |
18 |
EU778001; EU763449; AY726960; AB355083; FJ592715; FJ516977; EF190824; AY947962; CP000814; EU132011; FJ712505; EU592424; EU134203; FM873402 |
19 |
AF317763; EU459226; EU639371; FJ002234; EF592610; EF205470; EU133431; FJ167503; AY913233; AB198604; CU924983; EU662508; FJ712493; AB282966 |
20 |
EF019165; EU982406; FJ425646; FN563173; DQ383304; AY349381; EU134307; AF093251; CU918643; CU924912; EU133993; EU247889; EU245649; EU885068 |
21 |
AB192219; D11348; EU802784; CU923009; AJ291826; EU773650; GU061962; EU334768; FJ592772; EU385703; AY571473; FJ825446; AB465709; FJ004754 |
22 |
AB302409; EU669636; EU434533; FJ493498; FJ790619; FJ746187; EF379616; CU921631; EU915265; AF393378; DQ676384; AB234287; AB525461; AB089051 |
23 |
AY862537; EF097759; EU775762; GQ487946; AF385521; AJ306807; EU050858; EU802639; AY913288; EU236294; X89045; CU925964; AF521187; AB294345 |
24 |
DQ015655; EU507714; FJ425597; CP001739; FJ802178; FJ985790; FJ628291; EU409852; GQ402806; EF688228; EU721768; CU926616; DQ988318; GQ249498 |
25 |
FN554390; EU074225; AY266450; AB034054; FJ002173; EF522341; AJ299413; FJ628241; GQ355003; AF402980; CU927201; EU181504; AB237731; FJ879997 |
The revealed distribution of simplexes over the branches of phylogenetic tree has demonstrated that evolutionary relations between phyla are much more complicated than it is seen by conventional taxonomic ideas. Thus, the simplex 6 included 14 entries from different phyla evenly distributed over the entire tree, even extreme groups - Verrucomicrobia and Aquificae. The identified nature of simplex distribution indicated that positioning of the existing set of points while maintaining the pairwise distances is impossible in both 2D- and 3D- spaces. These results show that estimation of relations between phyla is an insoluble problem in spaces with dimensionality less than 13, which was one of the important outcomes of this study.
The phyla were almost evenly represented in simplexes, except Spirochaetes and Chloroflexi who were detected about 7 and 5 times more frequent than expected. The rest of the phyla were present in generally comparable ratio in both simplexes and in the database. Firmicutes and Proteobacteria, highly diverse and numerous in the database, often occurred in the simplex more than once. Therefore, genetic distances within one phylum can be no shorter than between different phyla.
Simplex search was performed in a constrained range of genetic distances providing an external localization of a simplex within a total set. For this reason, it’s still the question about the maximum size of a simplex with a minimum distance between its vertices, for example within a phylum. Probably, such simplexes can be of a greater dimensionality and efficient mapping using an external simplex as a defining point is impossible.
|
Fig. 2. Distribution of 25 identified 14-vertices simplexes over the major phyla of bacteria (constructed based on the nucleotide sequences of 16S-rRNA gene). Number of points per cell corresponds to the number of phylum entries; seven phyla not participating the construction are shown below the tree. Schematic representation according to M.S. Rappe et al. (15) in a random order. |
Mapping nucleotide sequences in the evolutionary space and construction of sections. The reference point for mapping the sequences was selected the simplex 6, because each of its vertices belongs to an only phylum and it includes one of the most distant phyla – Aqufiicae. According to the described procedure, geometric coordinates in the 14-dimensional space were determined for all sequences in the database. Upon these calculations, it was developed a reconstructed matrix of pairwise distances. The coefficient of its correlation with the true matrix (r) was small (=0,299) although statistically highly reliable (p = 0,000999 of one tailed test – statistical test used to check the alternative statistical hypothesis). Thus, at this stage of research there weren’t revealed any high correlation coefficients, which is most likely associated with insufficient space dimensionality. The next stage was the attempt to visualize spatial distribution of points, as topological relations can persist even in the absence of high correlations. It was clear that the obtained set of points couldn’t be visualized directly, so the authors applied the method of flat sections similar to computed tomography (see “Technique”) Figure 3 (A, B) shows the main patterns observed in the studied sections: the resulting evolutionary space had low though significant correlation with the true matrix of pairwise distances, and it showed clear trends to separation of the phyla.
The presented series of sections parallel to the basal plane 2-12 (Fig. 3, A) demonstrated a successive passage of the section plane through the whole set of points. In the obtained sections representatives of different phyla are shown by different colors. This model reveals a clear trend to isolation of bacterial phyla, more pronounced in central sections (i.e. passing through the geometric center) (Fig. 3B). There was also observed the trend to separation of representatives of different phyla, although the presence of mixing zones, apparently, indicating the insufficiency of resolution of low-dimensional spaces for full discrimination of taxa. At the same time, these sections revealed some quite unexpected topological relations. First of all, this construction had a distinct evolutionary nature. In the view of the generally accepted hypothesis about the origin of all bacteria from a common ancestor, it was clear that evolutionary process presented in the evolutionary space was expanding almost like the Big Bang. This expansion was irreversible (for statistical reasons) and, apparently, radial. Therefore, such space has an evolutionary center (a common ancestor), which most likely is empty because of elimination of ancestral gene variants in the global evolution. However, it can be identified considering at least two phyla - Proteobacteria and Cyanobacteria, particularly, a pronounced elongation of these two (Fig. 3, B) that also reflected fast evolution and antiquity of these phyla. If the hypothesis of radial expansion is true, the central axes of these phyla should intersect (or approach very close) is in the center of evolution, and this would be certainly one of the most promising issues of research. An interesting fact is that modern taxonomy considers organelles of eukaryotic cells as members of these phyla – chloroplasts (Cyanobacteria) and mitochondria (Proteobacteria). According to a preliminary analysis, chloroplasts belong to distal (relative to other bacteria) part of the phylum Cyanobacteria (data not shown). It should be also noted a “cavity” detected within the phylum Proteobacteria (Fig. 3, B, section 7-12), possibly, related to a missing position of old monophyletic taxa, but still unclear owing to the complexity of multidimensional topological relations.
Further improvement of the applied algorithm meets anticipated constraints associated with increased expansion of a simplex. The authors assume that even in the complete database it is low probable obtaining a simplex notably exceeding the one presented in this study, because reduction of the used database was just elimination of sequences with similarity greater than 99%. Should they be returned to the database, it won’t lead to expansion of the simplex, and distances between its vertices correspond to about 75% similarity. The authors suggest an unusual solution – constructing “artificial” nucleotide sequences providing simplex expansion (de novo, or by correcting current entries in the database). These tasks rise a number of technical problems, as well as even more difficult questions related to fundamental possibility of such constructions, their substantiation, and, if necessary, searching for alternative solutions.
So, this study had a purely practical purpose – presentation of the fundamentally new approach to integral analysis of multicomponent microbial communities in the environment, particularly, the most complex communities of soil microbiota. Using a working version of the evolutionary space allows a universal taxonomic mapping of bacteria with identification of fixed positions of all microorganisms - taxonomically attributed and unattributed, known and unknown. The development of working version of the evolutionary space can be a precondition for the introduction of powerful algorithms of data analysis, such as pattern recognition. Using these approaches can be a possibility to improve today’s knowledge about the laws of formation of microbial communities, their evolution and relations with the environment, and it also can reveal a new view of the evolution. At the present stage of research, the authors see their main task as improving mapping algorithms, and they expect to continue the presented investigations.
The authors express their sincere appreciation to V.V. Mottley and V.V. Sulimova for consulting on a range of issues related to multidimensional representation of the matrix of pairwise distances.
REFERENCES
1. O'Malley M.A., The Nineteenth Century Roots of “Everything Is Everywhere”, Nat. Rev. Microbiol., 2007, vol. 5, pp. 647-651.
2. Pace N.R., A Molecular View of Microbial Diversity and the Biosphere, Science, 1997, vol. 276, pp. 734-740.
3. Sogin M.L., Morrison H.G., Huber J.A., et al., Microbial Diversity in the Deep Sea and the Underexplored “Rare Biosphere”, PNAS USA, 2006, vol. 103, pp. 12115-12120.
4. Tringe S.G. and Hugenholtz P., A Renaissance for the Pioneering 16S rRNA Gene, Curr. Opin. Microbiol., 2008, vol. 11, pp. 442-446.
5. Lukashov V.V., Molekulyarnaya evolutsiya i filogeneticheskiy analiz (Molecular Evolution and Phylogenetic Analysis), Moscow, 2009.
6. Kunin V., Copeland A., Lapidus A., Mavromatis K., and Hugenholtz P., A Bioinformatician’s Guide to Metagenomics, Microbiol. Mol. Biol. Rev.,2008, vol. 72, no. 4, pp. 557-578.
7. Reisenfield S.C., Schloss P.D., and Handelsman J., Metagenomics: Genomic Analysis of Microbial Communities, Annu. Rev. Genet., 2004, vol. 13, pp. 525-552.
8. Linnaeus C., Filosofiya botanki (Philosophy of Botany), Moscow, 1989.
9. Darvin Ch., Proiskhozhdeniye vidov putyom estestvennogo otbora ili sokhraneniye blagopriyatnykh ras v bor’be za zhizn’ (On the Origin of Species by Means of Natural Selection, or the Preservation of Favored Races in the Struggle for Life), St. Petersburg, 1991.
10. Vavilov N.I., The Law of Homologous Series in the Inheritance of Variability, in Teoreticheskie osnovy selektsii rasteniy. T. 1. Obschaya selektsiya rasteniy (Theoretical Bases of Selection. Vol. 1 General Plant Selection), Moscow-Leningrad, 1935, pp. 75-128.
11. MantelN. and ValandR.S., ATechniqueofNonparametricMultivariateAnalysis, Biometrics, 1970, vol. 26, pp. 547-558.
12. Garrity G.M. and Lilburn T.G., Mapping Taxonomic Space: an Overview of the Road Map to the Second Edition of Bergey's Manual of Systematic Bacteriology, WFCC News, 2002, vol. 35, pp. 5-15.
13. Lee S.H., Hwang K.S., Lee H.R., et al., Embedding Operational Taxonomic Units in Three-Dimensional Space for Evolutionary Distance Relationship in Phylogenetic Analysis, in Proc. 5th WSEAS Int. Conf. on Circuits, Systems, Electronics, ControlandSignal Processing, USA, 2006, pp. 192-196.
14. Kitazoe Y., Kishino H., Okabayashi T., et al., Multidimentional Vector Space Representation for Convergent Evolution and Molecular Phylogeny, Mol. Biol. Evol., 2004, vol. 22, no. 3, pp. 704-715.
15. Rappe M.S. andGiovannoni S.J., The Uncultured Microbial Majority, Annu. Rev. Microbiol.,2003, vol. 57, pp. 369-394.
1St. Petersburg State University, St. Petersburg 199034, Russia, |
Received May 25, 2012 |
![]()