


УДК 633.111:632.4:632.4.01/.08
RESISTANCE OF ISOGENIC LINES OF Thatcher WHEAT WITH Lr-GENES TO CURRENT POPULATIONS OF BROWN RUST IN THE CONDITIONS OF NORTH-WEST OF RUSSIA
L.E. Kolesnikov, E.A. Vlasova, Yu.R. Kolesnikova
During 15 years the authors made monitoring for the brown rust agent development on 22 isogenic varieties of wheat with identified Lr-resistance genes. As the main parameters of pathogenesis estimation were used such as pustules number, spores number in pustule, pustules area, the plant’s reaction type. The wheat sample with Lr-resistance gene was having the minimal size of rust’s pustules number, calculated for the flag leaf surface unit. Distribution of wheat samples for two groups of rust resistance with use of the calculation data for definition of the pathogen development actual size on flag leaf surface had carried out.
Key words: wheat leaf rust, brown rust of wheat, pathogenesis, Thatcher isogenic lines, Lr-genes.
The actual directions of current studies include theoretical rationale for a set of varieties resistant to major pathogens and its use for prevention epiphytoties and realization of crop genetic potential (1).
Leaf rust is still the most damaging disease of wheat, despite the progress in studying the nature of plant resistance, pathogen population structure and variability, as well as practical breeding achievements. In the world, there are various programs of creating the wheat varieties carrying effective genes providing the long-term resistance to leaf rust, which closely connects to searching the sources of such genes (2-4).
The purpose of our work was studying the development of leaf rust pathogen in wheat isogenic lines of the variety Thatcher carrying the identified resistance Lr-genes.
Methods. The research was performed in 1995-2006 in experimental field of cereal genetics laboratory (N.I. Vavilov All-Russian SRI of Plant Industry) in Pushkino, Leningrad region.
The subject of study - 22 isogenic wheat samples : KS-90-WGRC-1 (к k-062377, Lr41); Francec (R.L.6084, Lr24); Thatcher x Aegilops squarrosa (R.L.6043, Lr21); Thatcher x South Africa 43 (R.L.6009, Lr18); Thatcher x Webster (R.L.6016, Lr2a); Zse FL 310/6 x Th (R.L.6012, Lr23); Thatcher x Maria Escobar (R.L.6006, Lr14b); Thatcher x Exchange (R.L.6011, Lr12); Thatcher x Sonalika (R.L.6011, Lr11); Thatcher x Frontana (R.L.4031, Lr13); Thatcher x Kavkaz (R.L.6048, Lr26); Thatcher 6 x Exchange lut (R.L.6005, Lr16); Thatcher x Ae. squarrosa (R.L.6044, Lr22a); Thatcher x Terenzio (R.L.6059, Lr34); Thatcher x Demokrat lut (R.L.6002, Lr3а); Canthatch (к k-44431, Lr22b); Thatcher x Carina (R.L.6019, Lr2b); Thatcher x Selkrirk (R.L.6013, Lr14a); the variety Leningradka (susceptible standard); Thatcher x Exchange (R.L.6004, Lr10); Thatcher x Klein Annivarsario (R.L.6007, Lr3ka); Thatcher x Bage (R.L.6042, Lr3bg). The listed samples were supposed to be used for testing the virulence of Puccinia recondita Rob. ex Desm. f. tritici Erikss. isolates (5). Plants were sown in plots 0,75 m2 (the variety Leningradka – a control and infection accumulator - was sown along the plots).
The variety Leningradka at the phase of full formation of flag leaf was inoculated with uredospores of P. recondita Rob. ex Desm. f. tritici Erikss. (the local pathogen population collected in spring on winter crops ) by spraying the spores suspension (10 thousand uredospores/sm3). The infected plants were sheltered under film frames to create the moist chamber conditions contributing to uredospores germination and introduction of the parasite. The film was removed in 16-20 h after inoculation. The number of pathogen pustules was accounted first on a whole leaf, and then - per 1 cm2 leaf surface in the process of pathogenesis. 20 plants of each sample were evaluated. During a season, the account was done 9 times within 38 days from the date of infection of the susceptible variety Leningradka.
The time-average index Q‾ of formation the pathogen pustules during a monitoring period was calculated under the formula for trapezium rule:
[1] |
denotation: n — number of accounts, Dti — period of time between the accounts № i and № (i+1), Q(ti) — the value of function Q for the account № i, Q(ti+1) — the value of Q for the account № (i+1).
The conditional (relative) degree of pathogen development Rus on flag leaf surface was estimated by Peterson’s scale (5).
The index of actual (real) degree of pathogen development Rd was calculated under the formula:
Rd = |
Sп.Nп. |
100 %, [2] |
Sфл. |
denotation: Sп. Sp — the area of pustule, Nп Np. — number of pustules, Sфл. Sfl. — flag leaf area.
Pustules dimensions (20 pcs. on flag leaves of each sample; repetition of accounts - 6-fold) were determined by microscopy with an ocular micrometer K7x (“LOMO”, Russia). The area of pustules (Sp) presuming their elliptical shape was calculated under the formula:
Sp. = mLpab,
denotation: a, b - lengths of ellipse semiaxes (in the lines of an ocular micrometer), m - microscope scale factor.
The number of spores in pustules were calculated using Goryaev’s chamber (7) in 5-fold repetition.
Types of plant response to the infection were classified by Mines-Jackson scale (8).
The data were processed using descriptive statistics (Statistica 6.0 software package). The conjugacy of parasite development degree with a term of account was assessed using correlation analysis.
Results. Figure 1 shows graphical models (tonal charts) reflecting the intensity of formation of pathogen pustules in the wheat samples carrying different resistance Lr-genes. The two-dimensional charts correspond to three-dimensional surface describing the conjugation between pathogen development and a term of account.
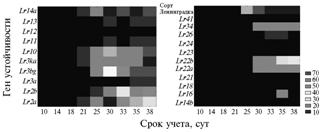 |
Fig. 1 Tonal chart showing the dynamics of formation the leaf rust pathogen pustules in wheat isogenic lines the variety Thatcher carrying different Lr-genes. Tonal scale – number of pustules (10-70 pcs.) Control – the susceptible variety Leningradka (the artificial infection background, Leningrad reg., 1999-2006). Note: |
Ranking the wheat samples by their time-average values of numbers of pathogen pustules, the number of spores per pustule and pustule area (Fig. 2) showed that the minimum number of pustules was detected in the sample carrying the resistance gene Lr24.
The degree of samples’ nonspecific resistance can be estimated by change in rate as time derivative from a number of pustules, which is equal to the slope ratio of a curve describing the dependence of damage degree from a term of account.
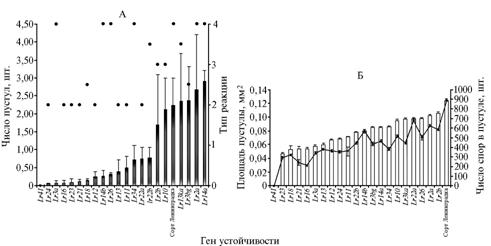 |
Fig. 2 Ranking wheat isogenic lines the variety Thatcher carrying different Lr-genes (in descending order) by their resistance level to leaf rust pathogen depending on estimated indicator: A A – number of pathogen pustules per unit of a flag leaf area according to the type of reaction (0, 1, 2, 3 and 4 – immune, highly-resistant, medium resistant, medium susceptible, highly susceptible), Б B – pustule area (bar chart) and number of spores per pustule (diagram). Control – the susceptible variety Leningradka (the artificial infection background, Leningrad reg., 1995-2006). Note: |
1. Time derivative values for number of pathogen pustules in wheat isogenic lines the variety Thatcher carrying different Lr-genes (the artificial infection background, Leningrad reg., 1995-2006). |
||||||||||
Sample |
Gene |
Period after the inoculation, days |
Average |
|||||||
10th |
14th |
18th |
21st |
25th |
30th |
33rd |
35th |
|||
KS-90-WGRC-10 (к k-062377) |
Lr41 |
0 |
0 |
0 |
0 |
0 |
0 |
0 |
0 |
0 |
Francec (R.L.6084) |
Lr24 |
0,01 |
0,00 |
0,05 |
0,09 |
0,09 |
0,19 |
0,05 |
0,06 |
0,07 |
Thatcher x Aegilops squarrosa (R.L.6043) |
Lr21 |
0,04 |
0,07 |
0,15 |
0,16 |
0,21 |
-0,20 |
0,15 |
0 |
0,07 |
Thatcher x South Africa 43 (R.L.6009) |
Lr18 |
0,03 |
0,05 |
0,14 |
0,32 |
0,21 |
-0,22 |
0,45 |
-0,12 |
0,11 |
Thatcher x Webster (R.L.6016) |
Lr2a |
0,07 |
0,75 |
1,50 |
2,56 |
12,02 |
-9,19 |
-3,21 |
-3,57 |
0,12 |
Zse FL 310/6 x Th (R.L.6012) |
Lr23 |
0,01 |
0,08 |
0,06 |
0,06 |
0,05 |
0,78 |
-0,07 |
-0,02 |
0,12 |
|
||||||||||
Thatcher x Maria Escobar (R.L.6006) |
Lr14b |
0,01 |
0,15 |
0,19 |
0,19 |
1,16 |
-0,69 |
0,40 |
-0,38 |
0,13 |
Thatcher x Exchange (R.L.6011) |
Lr12 |
0 |
0,03 |
0,20 |
0,33 |
0,65 |
0,58 |
-1,32 |
0,96 |
0,18 |
Thatcher x Sonalika (R.L.6011) |
Lr11 |
0,07 |
0,26 |
0,43 |
0,84 |
0,62 |
-1,04 |
1,10 |
0,27 |
0,32 |
Thatcher x Frontana (R.L.4031) |
Lr13 |
0,12 |
0,12 |
1,35 |
0,44 |
0,27 |
-0,32 |
1,25 |
-0,13 |
0,39 |
Thatcher x Kavkaz (R.L.6048) |
Lr26 |
0 |
0,10 |
0,11 |
0,46 |
0,82 |
1,62 |
-0,33 |
0,47 |
0,40 |
Thatcher 6 x Exchange lut (R.L.6005) |
Lr16 |
0 |
0 |
0 |
0 |
0,15 |
-0,12 |
8,56 |
-5,26 |
0,42 |
Thatcher x Ae. squarrosa (R.L.6044) |
Lr22a |
0,14 |
0,19 |
0,53 |
0,86 |
2,22 |
0,36 |
-0,39 |
-0,11 |
0,48 |
Thatcher x Terenzio (R.L.6059) |
Lr34 |
0,03 |
0,28 |
0,19 |
0,55 |
2,87 |
-0,35 |
1,95 |
-1,08 |
0,56 |
Thatcher 6 x Demokrat lut (R.L.6002) |
Lr3а |
0 |
0 |
0 |
0 |
0,15 |
-0,12 |
6,34 |
-1,39 |
0,62 |
Canthatch (к k-44431) |
Lr22b |
0,01 |
0,17 |
0,11 |
0,22 |
3,40 |
-0,21 |
4,74 |
2,63 |
1,38 |
Thatcher x Carina (R.L.6019) |
Lr2b |
0,06 |
0,41 |
0,93 |
1,36 |
9,57 |
-6,39 |
6,62 |
-1,05 |
1,44 |
Thatcher x Selkrirk (R.L.6013) |
Lr14a |
0,28 |
0,80 |
1,86 |
2,40 |
11,53 |
-2,07 |
1,86 |
-2,75 |
1,74 |
Thatcher x Exchange (R.L.6004) |
Lr10 |
0,07 |
0,51 |
2,12 |
1,86 |
5,69 |
5,94 |
-2,70 |
4,45 |
2,24 |
Thatcher x Klein Annivarsario (R.L.6007) |
Lr3ka |
0,05 |
1,03 |
1,39 |
1,69 |
8,93 |
1,15 |
-0,23 |
4,67 |
2,33 |
Thatcher x Bage (R.L.6042) |
Lr3bg |
0,12 |
0,55 |
1,67 |
2,81 |
4,40 |
2,59 |
11,19 |
0,18 |
2,94 |
The variety Leningradka (control) |
0,64 |
0,37 |
0,53 |
6,59 |
6,47 |
4,67 |
-0,28 |
-1,80 |
2,15 |
|
The calculation of derivatives (Table 1) revealed no symptoms of pathogen development in the sample KS-90-WGRC-10 ( к k-062377) – the carrier of Lr41 resistance gene. The minimum value of the derivative was observed in the sample Francec (RL6084) carrying the resistance gene Lr24, the maximum – in the sample Thatcher Í Bage (R.L.6042) possessing the gene Lr3ka. In 30 days following the infection of the susceptible standard Leningradka, 55% samples demonstrated the decline in pathogenesis development, which was proved by negative values of the derivatives.
Table 2 shows the indices of total number of uredospores in pustules, the estimated pathogen-affected area of flag leaf surface and the real degree of disease development.
2. The development rate of leaf rust pathogen in wheat isogenic lines the variety Thatcher carrying different Lr-genes (the artificial infection background, Leningrad reg., 1995-2006). |
|||||
Sample |
Gene |
Statistical index |
Estimated affected area, mm2 |
Number of uredospores in pustules, pcs. |
Real degree of disease development, % |
KS-90-WGRC-10 (к k -062377) |
Lr41 |
х |
0 |
0 |
0 |
Sx |
0 |
0 |
0 |
||
Francec (R.L.6084) |
Lr24 |
х |
0,04 |
226,28 |
0 |
Sx |
0 |
0,39 |
0 |
||
Zse FL 310/6 x Th (R.L.6012) |
Lr23 |
х |
0,05 |
346,27 |
0 |
Sx |
0 |
0,62 |
0 |
||
Thatcher 6 x Exchange lut (R.L.6005) |
Lr16 |
х |
0,10 |
381,95 |
0 |
Sx |
0 |
0,33 |
0 |
||
Thatcher 6 x Demokrat lut (R.L.6002) |
Lr3а |
х |
0,10 |
607,82 |
0 |
Sx |
0 |
1,07 |
0 |
||
Thatcher x Aegilops squarrosa (R.L.6043) |
Lr21 |
х |
0,07 |
325,20 |
0,01 |
Sx |
0 |
3,09 |
0 |
||
Thatcher x South Africa 43 (R.L.6009) |
Lr18 |
х |
0,09 |
543,35 |
0,01 |
Sx |
0 |
1,25 |
0 |
||
Thatcher x Exchange (R.L.6011) |
Lr12 |
х |
0,18 |
966,19 |
0,02 |
Sx |
0 |
1,56 |
0 |
||
Thatcher x Maria Escobar (R.L.6006) |
Lr14b |
х |
0,24 |
1729,36 |
0,02 |
Sx |
0 |
3,36 |
0 |
||
|
|
|
|
|
|
|
|||||
Thatcher x Frontana (R.L.4031) |
Lr13 |
х |
0,31 |
1977,88 |
0,02 |
Sx |
0 |
1,04 |
0 |
||
Thatcher x Kavkaz (R.L.6048) |
Lr26 |
х |
0,41 |
2092,42 |
0,03 |
Sx |
0 |
4,27 |
0 |
||
Thatcher x Sonalika (R.L.6011) |
Lr11 |
х |
0,33 |
1667,69 |
0,03 |
Sx |
0 |
11,16 |
0 |
||
Canthatch (к k -44431) |
Lr22b |
х |
0,72 |
4148,06 |
0,06 |
Sx |
0 |
3,60 |
0 |
||
Thatcher x Terenzio (R.L.6059) |
Lr34 |
х |
0,69 |
3085,06 |
0,06 |
Sx |
0 |
3,56 |
0 |
||
Thatcher x Ae. squarrosa (R.L.6044) |
Lr22a |
х |
0,82 |
5743,92 |
0,07 |
Sx |
0 |
4,16 |
0 |
||
Thatcher x Carina (R.L.6019) |
Lr2b |
х |
2,27 |
12618,50 |
0,18 |
Sx |
0 |
11,01 |
0,01 |
||
Thatcher xÍ Exchange (R.L.6004) |
Lr10 |
х |
2,37 |
12913,44 |
0,20 |
Sx |
0 |
5,65 |
0 |
||
Thatcher x Bage (R.L.6042) |
Lr3bg |
х |
2,11 |
10854,98 |
0,20 |
Sx |
0 |
10,77 |
0,01 |
||
Thatcher x Klein Annivarsario (R.L.6007) |
Lr3ka |
х |
2,73 |
12466,85 |
0,23 |
Sx |
0 |
10,14 |
0,01 |
||
Thatcher x Selkrirk (R.L.6013) |
Lr14a |
х |
2,80 |
15321,43 |
0,25 |
Sx |
0 |
8,76 |
0 |
||
Thatcher x Webster (R.L.6016) |
Lr2a |
х |
2,66 |
16254,91 |
0,27 |
Sx |
0 |
11,05 |
0,01 |
||
The variety Leningradka (control) |
х |
4,28 |
30605,23 |
0,28 |
|
Sx |
0 |
7,54 |
0,01 |
||
Note: x — average value, Sх — standard error. |
|||||
Two groups of samples were formed by their values of actual (real) degree of pathogen development (see Table 2).
The first group (Rd = 0-0,07 %) included the samples KS-90-WGRC-10 (к k-062377, Lr41), Francec (R.L.6084, Lr24), Zse FL 310/6 x Th (R.L.6012, Lr23), Thatcher 6 x Exchange lut (R.L.6005, Lr16), Thatcher 6 x Demokrat lut (R.L.6002, Lr3а), Thatcher x Ae. squarrosa (R.L.6043, Lr21), Thatcher x South Africa 43 (R.L.6009, Lr18), Thatcher x Exchange (R.L.6011, Lr12), Thatcher x Maria Escobar (R.L.6006, Lr14b), Thatcher x Frontana (R.L.4031, Lr13), Thatcher x Kavkaz (R.L.6048, Lr26), Thatcher x Sonalika (R.L.6011, Lr11), Canthatch (к k-44431, Lr22b), Thatcher x Terenzio (R.L.6059, Lr34), Thatcher x Ae. squarrosa (R.L.6044, Lr22a).
The second group (Rd =0,20-0,28 %): Thatcher x Exchange (R.L.6004, Lr10), Thatcher x Bage (R.L.6042, Lr3bg), Thatcher x Klein Annivarsario (R.L.6007, Lr3ka), Thatcher x Selkrirk (R.L.6013, Lr14a), That-cher x Webster (R.L.6016, Lr2a).
|
Fig.3 Regression model showing the dependence between values of relative (Rus) and real (Rd) degree of leaf rust pathogen development in wheat isogenic lines the variety Thatcher carrying different Lr-genes (the artificial infection background, Leningrad reg., 1999-2006), 95 % confidence interval. Note: |
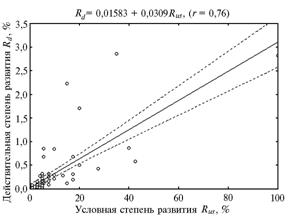
The data obtained for the observation period suggested the equation of linear regression reflecting the relationship between real Rd and relative Rus degree of leaf rust pathogen development determined by Peterson’s scale (Fig. 3).
This dependence can be also described by the equation of stepwise regression: Rd = 0,017814 + 0,012480 Rus (correlation coefficient r = 0,8; coefficient of determination r2 = 65,5%).
Application of stepwise regression allows to select from many pathogenesis indicators the independent variables most important for adequate representation of source data, which significantly increased the accuracy of the established regression model.
Thus, have studied the development of wheat brown rust in host-plants with different expression of Lr-genes, it allows to estimate plant resistance to the pathogen in most of isogenic lines the variety Thatcher as partial, or the type of resistance “slow development of the disease”. For the number of pathogenesis indicators, it has been noted the efficiency loss in most of the studied Lr-genes earlier used in breeding and genetic practice, probably due to microevolutionary processes in populations of wheat leaf rust pathogen. The results of this research can be used in breeding and genetic programs of creation the forms resistant to leaf rust pathogen populations in the North-West region of Russia.
1. З а х а р е н к о В.А. Изучение иммунитета растений к вредным организмам в программе фундаментальных и прикладных исследований по научному обеспечению развития агропромышленного комплекса Российской Федерации на 2006-2010 годы. Мат. II Всерос. конф. «Современные проблемы иммунитета растений к вредным организмам». СПб, 2008: 3-7.
2. М и х а й л о в а Л.А. Генетика взаимоотношений возбудителя бурой ржавчины и пшеницы. СПб, 2006.
3. У р б а н о в и ч О.Ю., М а л ы ш е в С.В., Д о л м а т о в и ч Т.В., К а р т е л ь Н.А. Определение генов устойчивости к бурой ржавчине в сортах пшеницы (Triticum aestivum L.) с использованием молекулярных маркеров. Генетика, 2006, 42(5): 675-683.
4. Г у л ь т я е в а Е.И., А л п а т ь е в а Н.В., В л а с о в а Э.А., К л и м е н т ь е в а О.Э. Характеристика устойчивости к бурой ржавчине сортов пшеницы, возделываемых в России. В сб.: Лаборатория микологии и фитопатологии им. А.А. Ячевского ВИЗР. История и современность. СПб, 2007: 119-130.
5. M c I n t o s h R.A., W e l l i n g s C.R., Р а r к R.F. Wheat rust: An atlas of resistance genes. Melbourne, Australia, CSIRO, 1995.
6. Г е ш е л е Э.Э. Основы фитопатологической оценки в селекции растений. М., 1978.
7. О д и н ц о в а И.Г., М и х а й л о в а Л.А. Лабораторный метод определения неспецифической устойчивости пшеницы к бурой ржавчине. С.-х. биол., 1981, 1(16): 137-140.
8. M a i n s E.B., J a c k s o n H.C. Physiologic specialisation in leaf rust Pucciniatriticina Erikss. et Henn. Phytopathology, 1926, 16: 89-120.
St.Petersburg State Agrarian University, |
Received May 29, 2007 |
![]()